Newsletter
Stay up to date with the latest Sensoterra product updates, customer stories, and company news. Sign up Now
See soil moisture across every part of your field, not just where a probe happens to sit, so you know exactly when to irrigate and when to hold off.
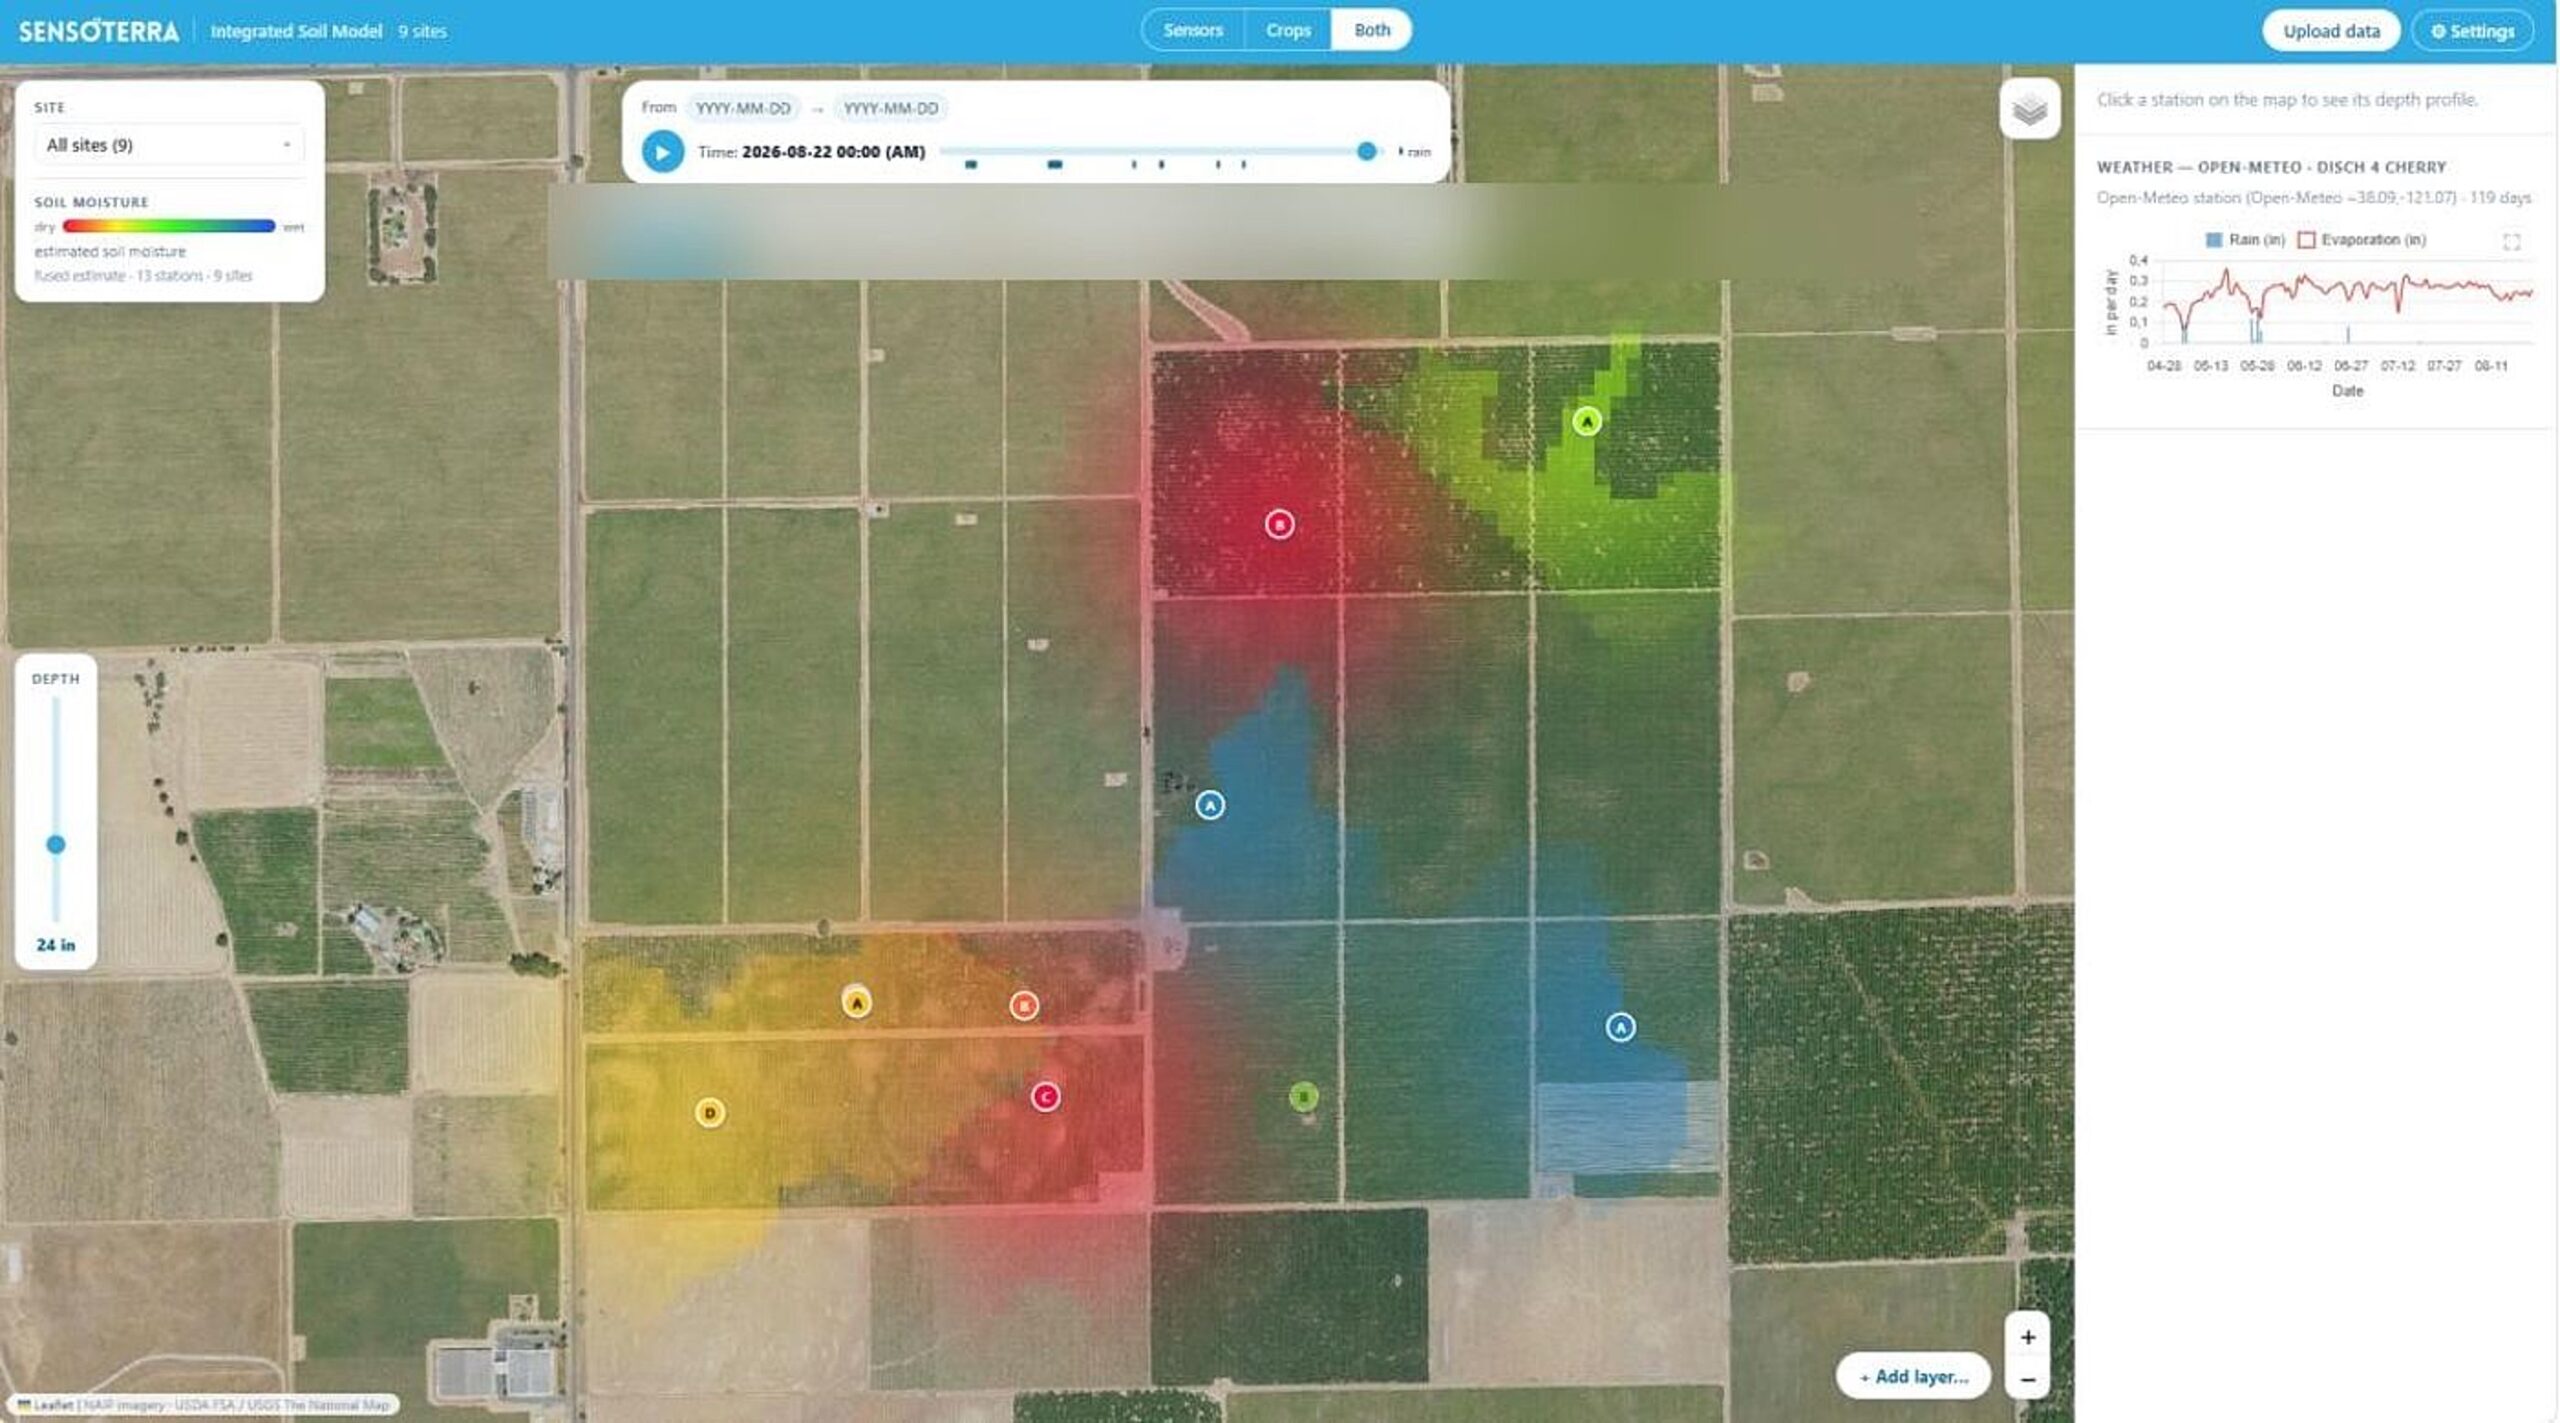
Whether you irrigate today or wait until tomorrow, that call is about the whole field, not the few square meters where a sensor happens to be. Between probes, most growers are still estimating.
Soil survey data, weather & ET forecasts, topography, your irrigation schedule, and your own field observations, combined into one field-level picture, calibrated to your soil.
Interpolated between your sensors, weighted by soil, weather and elevation, and tracked over time, so you see how the field behaves across the season, not just today's snapshot.
Soil, weather, topography and your own field data all feed one model, so no single reading has to carry the whole picture on its own.
Every reading is checked against our own calibration library: over 50 soil types, calibrated in our lab over years. Soil is dynamic, so this isn't a one-time setup. The model keeps checking, and automatically switches to the right soil type if the composition at that spot changes. You can also add your own soil survey results to optimize it further, so the model reflects your exact field.
the model estimates soil moisture across spots without a probe too. By adding data sources as your own weather station or field data you get your own field-level soil moisture model.
These are the decisions that shape this season, and the next twenty seasons.
Agriculture uses 70% of the world's freshwater, and up to 40% of that is lost to over- or under-irrigation. Precision irrigation, informed by the whole field instead of one point, is how that water starts going where the crop can actually use it.
Catching stress early, at the field level, is what keeps orchards and vineyards productive for decades, not just this season.
Fewer manual checks, fewer irrigation sets run on a guess. Both add up over a season.
Every season you monitor adds to the history for this exact field. That's what eventually turns today's readings into next season's forecast.
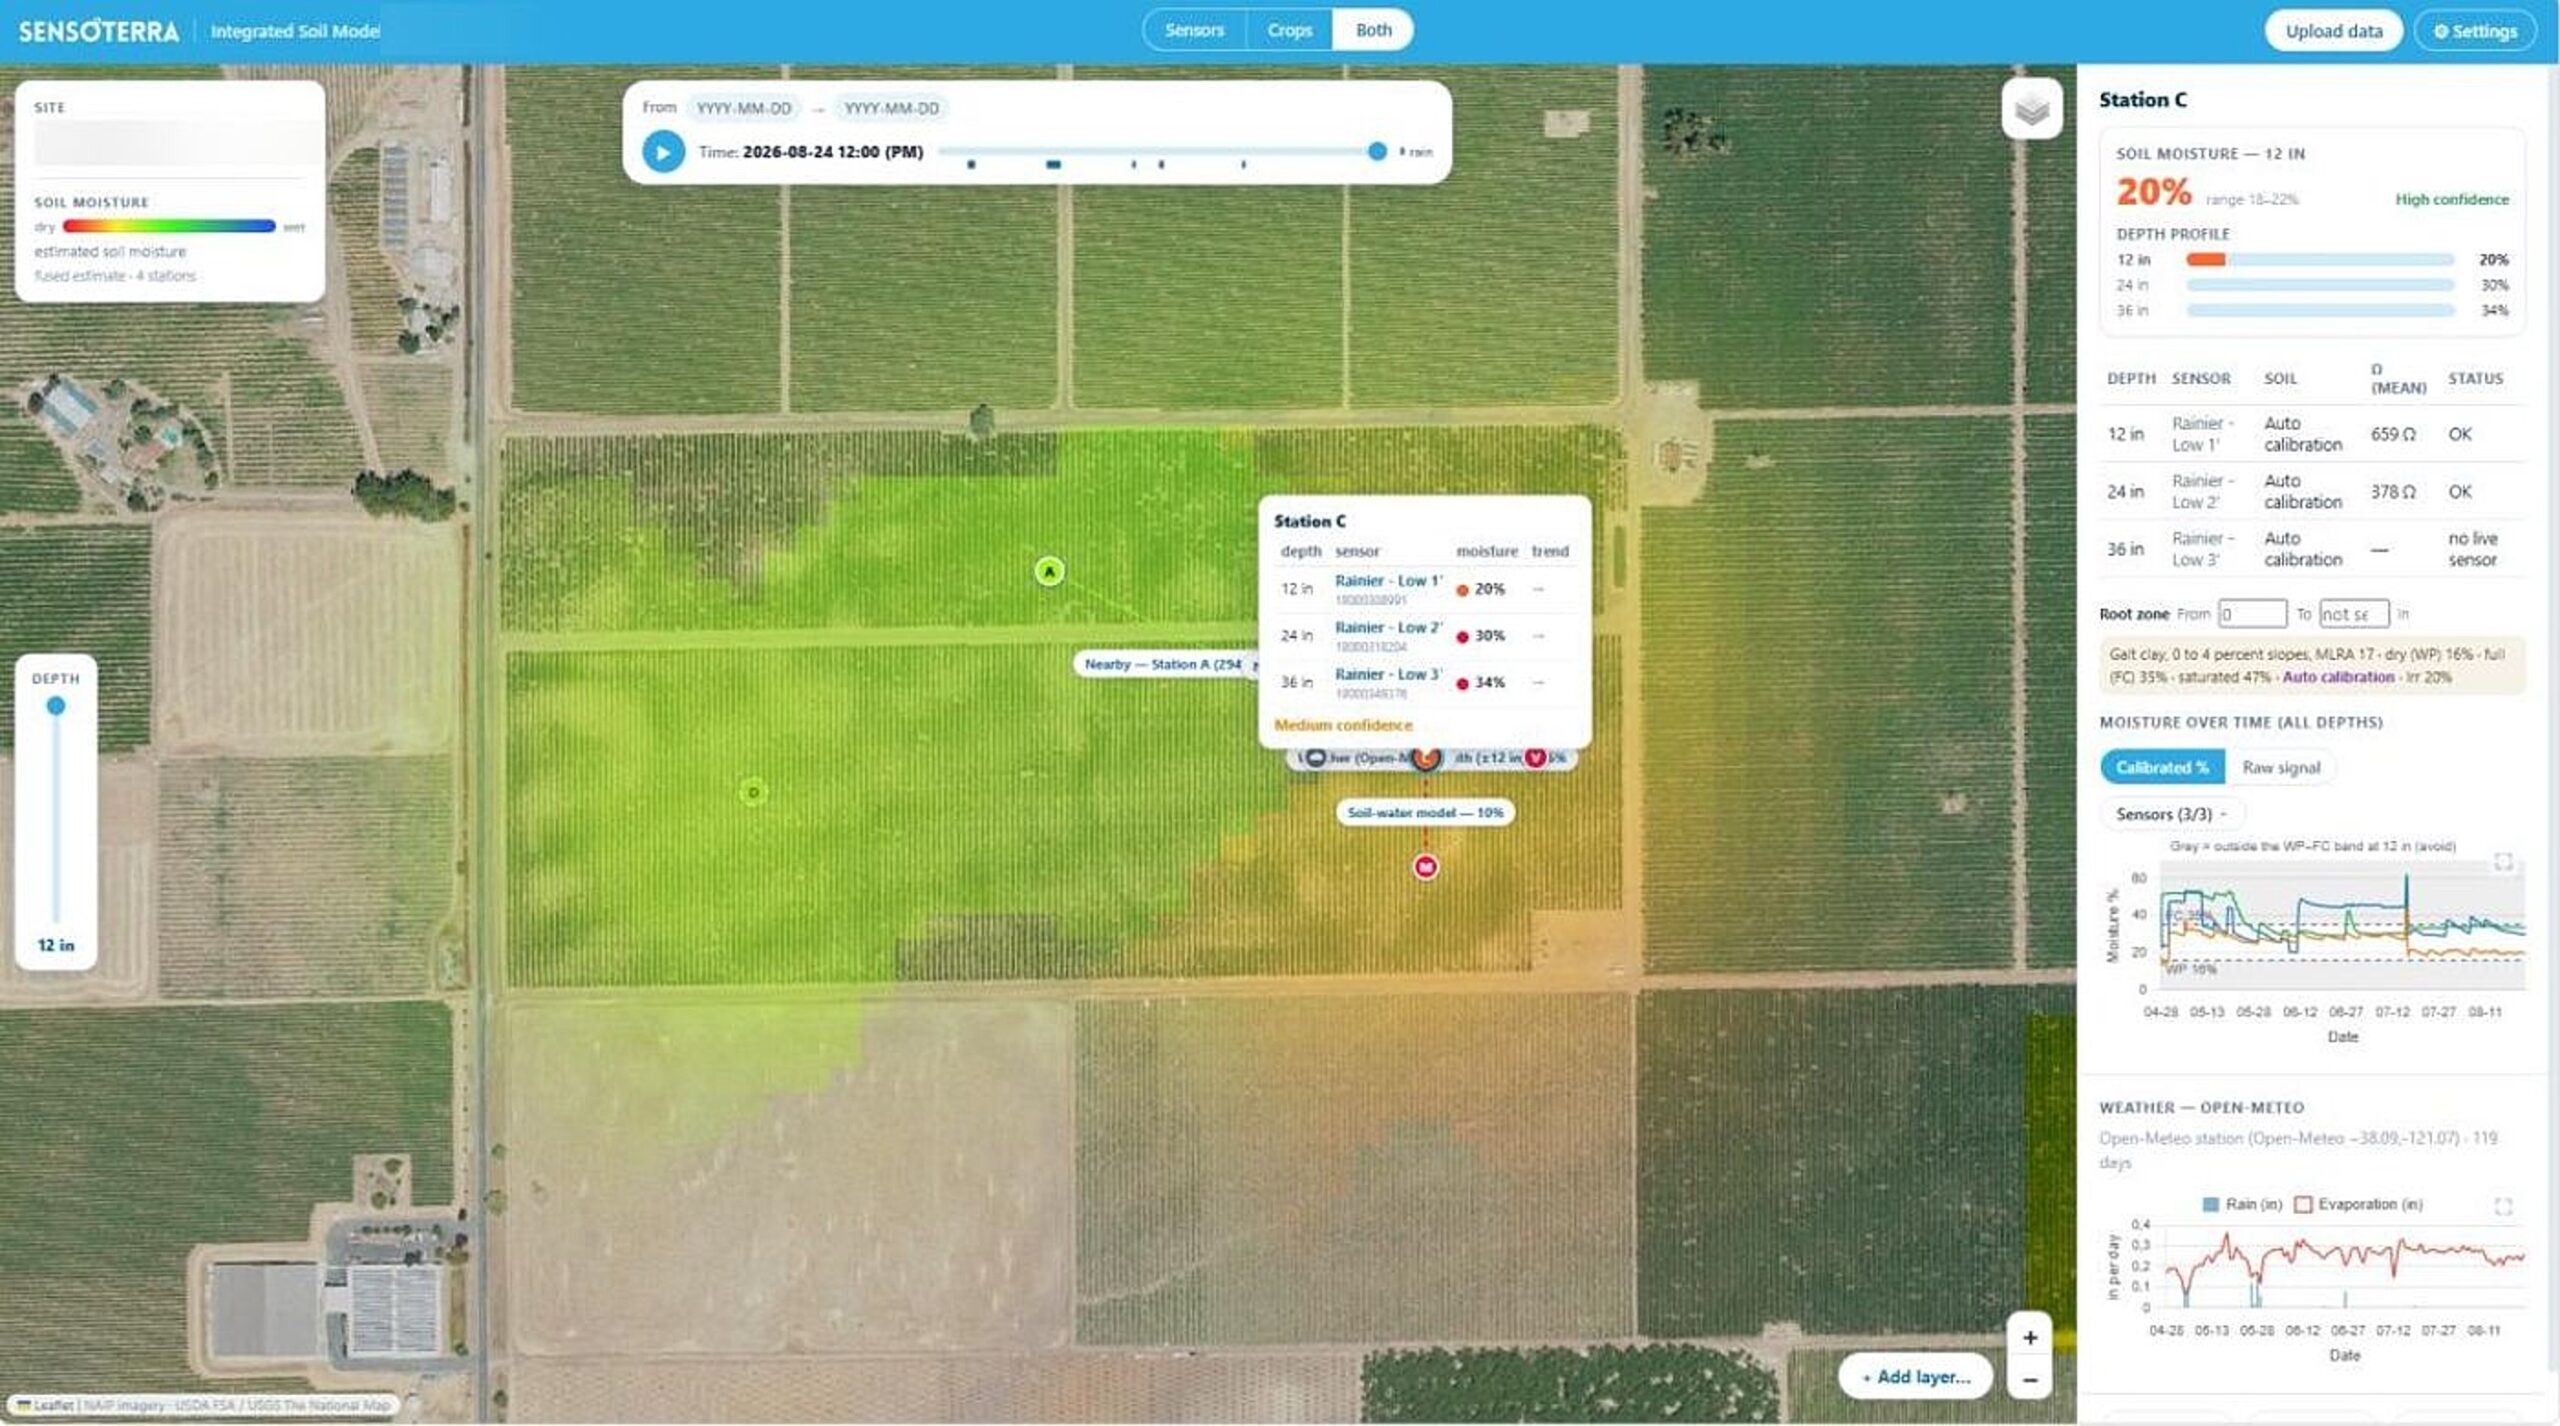
One of our clients, a multi-site drip-irrigated orchard operation growing cherries, apples and walnuts in California, was tracking 34 sensors. Looked at one sensor at a time, 18 of them raised questions: flat lines that seemed hard to square with what was happening in the fields.
The model combines the readings from every depth at a station into one cross-section of the field. Seen that way, some of those flat lines turned out to be exactly what you'd expect: deep probes sitting below where drip irrigation reaches, correctly showing little movement. Others pointed to a soil calibration setting that didn't match the actual soil, and needed correcting.
For the client's soil moisture manager, that cross-section did two things: it confirmed patterns already suspected from experience in the field, and it surfaced dynamics deep in the soil that aren't visible without a soil auger.
When something in the field doesn't match the screen, flag it in a few taps: a dry corner, an unexpected soil reading, a healthy patch. Every correction feeds back into the model, and that's what makes it smarter over time. The more accurate field data it receives, the better the output, for your fields specifically.
It combines readings from multiple sensors with soil survey data, weather, topography and irrigation records to estimate soil moisture across an entire field, not just at the points where sensors are installed.
Every reading is checked against our own calibration library: over 50 soil types, calibrated in our lab over years. Soil is dynamic, so this isn't a one-time setup. The model keeps checking, and automatically switches to the right soil type if the composition at that spot changes. You can also add your own soil survey results to optimize it further.
Yes. Past irrigation schedule data can be added, and the model also lets you record irrigation events as they happen. Combined with weather data, that makes it immediately clear what caused a rise on the moisture graph.
Yes. The Integrated Soil Model lets a consultant view multiple sites and fields in one dashboard, replay soil moisture history over time, and inspect any station's depth profile in detail.
Tell us about your fields and sensors, and we'll put together a quote for your setup. We're happy to walk through what the model looks like on your own soil as part of that.
Request a quoteStay up to date with the latest Sensoterra product updates, customer stories, and company news. Sign up Now